
Page 7 - 2003-2004
P. 7
REGIONS
Armenia is divided into 11 regions (marzes): Aragats, Ararat, Armavir, Gegharkunik,
Kotayk, Lori, Syunik, Shirak, Tavush, Vayots Dzor and the city of Yerevan. These
regions are headed by marzpets (governors).
JUDICIAL SYSTEM
The Judicial Branch of Armenia is represented by the Constitutional Court and
courts of general jurisdiction: courts of first instance, courts of appeal and
review courts.
ECONOMIC OVERVIEW
Armenia ranks as the most economically free nation in the CIS
(www.heritage.org/index)
Armenia was included in the list of countries with a high degree of economic
th
freedom in 2002 occupying 45 place together with France according to the annual
survey “Index of Economic Freedom” conducted by the Heritage Foundation / the
Wall Street Journal. In 2003 Armenia occupied 44th place.
The appraisal of economic freedom was based on 50 economic indicators: capital
flows and foreign investments; banking and financial systems; monetary, budget
and trade polices; salaries and prices; state interference in the economy;
property rights and regulations; and black markets.
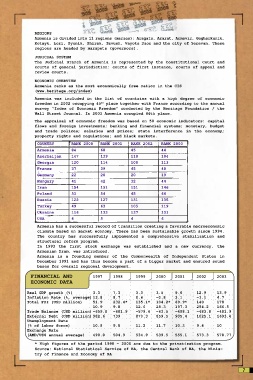
COUNTRY RANK 2000 RANK 2001 RANK 2002 RANK 2003
Armenia 84 68 45 44
Azerbaijan 147 139 118 104
Georgia 120 114 108 113
France 37 39 45 40
Germany 22 20 20 19
Hungary 41 42 32 44
Iran 154 151 151 146
Poland 53 54 45 66
Russia 122 127 131 135
Turkey 49 63 105 119
Ukraine 116 133 137 131
USA 4 5 4 6
Armenia has a successful record of transition creating a favorable macroeconomic
climate based on market economy. There has been sustainable growth since 1994.
The country has successfully implemented a comprehensive stabilization and
structural reform program.
In 1993 the first stock exchange was established and a new currency, the
Armenian Dram, was introduced.
Armenia is a founding member of the Commonwealth of Independent States in
December 1991 and has thus become a part of a bigger market and ensured sound
bases for overall regional development.
FINANCIAL AND 1997 1998 1999 2000 2001 2002 2003
ECONOMIC DATA ○ ○ ○ ○ ○ ○ ○ ○ ○ ○ ○ ○ ○ ○
Real GDP growth (%) ○ ○ 3.3 ○ ○ 7.3 ○ ○ 3.3 ○ ○ 3.5 ○ ○ 9.6 ○ ○ 12.9 ○ ○ 13.9
○ ○ ○ ○ ○ ○ ○ ○ ○ ○ ○ ○ ○ ○ ○ ○ ○ ○ ○ ○ ○ ○ ○ ○ ○ ○ ○ ○ ○ ○ ○ ○ ○ ○ ○ ○ ○ ○ ○ ○ ○ ○ ○ ○ ○ ○ ○ ○ ○ ○ ○ ○ ○ ○ ○ ○ ○ ○ ○ ○ ○ ○ ○ ○ ○ ○
Inflation Rate (%, average) ○ 8.7 0.6 -0.8 ○ 3.1 ○ -1.1 ○ 4.7
○ 13.8
○ ○ ○ ○ ○ ○ ○ ○ ○ ○ ○ ○ ○ ○ ○ ○ ○ ○ ○ ○ ○ ○ ○ ○ ○ ○ ○ ○ ○ ○ ○ ○ ○ ○ ○ ○ ○ ○ ○ ○ ○ ○ ○ ○ ○ ○ ○ ○ ○ ○ ○ ○ ○ ○ ○ ○ ○ ○ ○ ○ ○
Total FDI (USD million) ○ 51.9 ○ 232.4* ○ 135.1* ○ 104.2* ○ 69.9* ○ 140 ○ 178
○
○ 10.9 ○ ○ 9.8 ○ 12.6 ○ 28.3 ○ ○ 197.3 ○ ○ 254.2 ○ ○ 166.5
○ ○ ○ ○ ○ ○ ○ ○ ○ ○ ○ ○ ○ ○ ○ ○ ○ ○ ○ ○ ○ ○ ○ ○ ○ ○ ○ ○ ○ ○ ○ ○ ○ ○ ○ ○ ○ ○ ○ ○ ○ ○ ○ ○ ○ ○ ○ ○ ○ ○ ○ ○ ○ ○ ○ ○ ○ ○ ○ ○ ○
Trade Balance (USD million) -659.8 ○ -681.9 ○ -579.6 ○ -63.5 ○ -408.1 ○ -483.8 ○ -481.9
○
○ ○ ○ ○ ○ ○ ○ ○ ○ ○ ○ ○ ○ ○ ○ ○ ○ ○ ○ ○ ○ ○ ○ ○ ○ ○ ○ ○ ○ ○ ○ ○ ○ ○ ○ ○ ○ ○ ○ ○ ○ ○ ○ ○ ○ ○ ○ ○ ○ ○ ○ ○ ○ ○ ○ ○ ○ ○ ○ ○ ○ ○ ○ ○ ○ ○
○ 982.6
External Debt (USD million) ○ 739 870.3 859.5 ○ 905.4 ○ 1025.1 ○ 1693.6
○ ○ ○ ○ ○ ○ ○ ○ ○ ○ ○ ○ ○ ○ ○ ○ ○ ○ ○ ○ ○ ○ ○ ○ ○ ○ ○ ○ ○ ○ ○ ○ ○ ○ ○ ○ ○ ○ ○ ○ ○ ○ ○ ○ ○ ○ ○ ○ ○ ○ ○ ○ ○ ○ ○ ○ ○ ○ ○ ○ ○
Unemployment Rate
(% of labor force) ○ 10.8 ○ 9.8 ○ 11.2 ○ 11.7 ○ 10.3 ○ 9.4 ○ 10
○ ○ ○ ○ ○ ○ ○ ○ ○ ○ ○ ○ ○ ○ ○ ○ ○ ○ ○ ○ ○ ○ ○ ○ ○ ○ ○ ○ ○ ○ ○ ○ ○ ○ ○ ○ ○ ○ ○ ○ ○ ○ ○ ○ ○ ○ ○ ○ ○ ○ ○ ○ ○ ○ ○ ○ ○ ○ ○ ○ ○ ○ ○ ○ ○ ○
Exchange Rate ○ ○ ○ ○ ○ ○ ○
(AMD/US$ annual average) ○ 490.8 ○ 504.9 ○ 534.9 ○ 539.5 ○ 555.1 ○ 573.3 ○ 578.77
○ ○ ○ ○ ○ ○ ○
* High figures of the period 1998 - 2000 are due to the privatization program.
Source: National Statistical Service of RA, the Central Bank of RA, the Minis-
try of Finance and Economy of RA
7 7 7 7 7